
Interactive TUI explorer
The DebtDrone TUI is a full-screen terminal application built with Bubble Tea v2 and styled with Lipgloss. It is designed for the exploratory half of the workflow: understanding a codebase, spotting trends across scan history, and adjusting analysis settings — all without leaving the terminal.
This guide covers interactive slash commands. Headless commands and flags are listed separately in the command reference.
Launching the TUI
Section titled “Launching the TUI”Type debtdrone with no arguments:
debtdroneThe application opens to a keyboard-first dashboard. Its Primary actions panel makes scanning, path selection, session history, settings, help, and quit available without memorizing commands. The Recent scans panel loads the three newest summaries from DebtDrone’s shared local history store.
Terminal requirements
Section titled “Terminal requirements”DebtDrone supports terminals of 60×16 or larger. Below either dimension it replaces the interface with a message naming the current and required size rather than drawing a layout that cannot fit.
Between 60 and 96 columns the interface uses a compact layout: the dashboard stacks its panels instead of placing them side by side, recent scans collapse to one line each when the terminal is also short, and the findings table drops its category column so the message column stays readable. When both dashboard panels cannot fit vertically, moving focus between actions and recent scans swaps the visible panel. No information is removed from the interface — only from columns that have somewhere else to show it. The findings table always shows the file name; the full path is in the detail pane below it.
Without colour
Section titled “Without colour”DebtDrone follows the terminal’s colour capability, including NO_COLOR.
Nothing depends on colour alone:
- severity is spelled out (
critical,high,medium,low) beside its colour; - the focused row is marked with
›, not only highlighted; - outcomes are labelled
COMPLETEDorPARTIAL.
In an uncoloured terminal the scan spinner is replaced with a static marker; the elapsed time and completed-analyzer count still report progress.
Navigation
Section titled “Navigation”DebtDrone uses familiar Vim-style keybindings throughout every view.
| Key | Action |
|---|---|
j / ↓ |
Move selection down |
k / ↑ |
Move selection up |
Enter |
Confirm selection / drill into detail |
Esc / q |
Return to the dashboard from a completed child view |
Tab |
Move dashboard focus or cycle command-palette completions |
Ctrl+C |
Exit the application from any view |
Individual views add keys such as g/G, page navigation, results filtering,
and configuration editing. During an active scan, navigation keys are ignored
and only cancellation is accepted: Esc stops the scan and returns to the
dashboard, Ctrl+C stops it and exits.
The help reference and reopened recent-scan summaries scroll with j/k, the
arrow keys, PgUp/PgDn, or g/G. Their exit and action hints remain pinned
at the bottom of the terminal while the content moves.
The Dashboard
Section titled “The Dashboard”Use j/k, the arrow keys, or Tab to move through the visible rows, then
press Enter to open the focused action. Returning from another view restores
the previous dashboard focus and refreshes recent history.
| Action | Shortcut | Result |
|---|---|---|
| Scan current directory | s |
Start a scan of the directory where DebtDrone launched |
| Choose repository path | p |
Open the command palette with /scan ready for a path |
| Session scan history | h |
Browse full findings retained during this TUI process |
| Settings | c |
Open the session settings editor |
| Keyboard help | ? |
Show dashboard shortcuts and slash commands |
| Quit DebtDrone | q |
Exit to the shell |
| Newest recent scan | r |
Reopen its persisted summary |
Recent rows show the privacy-safe repository name, completion time, outcome,
finding count, and critical/high/medium/low breakdown. Press Enter on any
recent row to reopen its summary. Source code and full finding details are not
persisted, so those remain available only from session history.
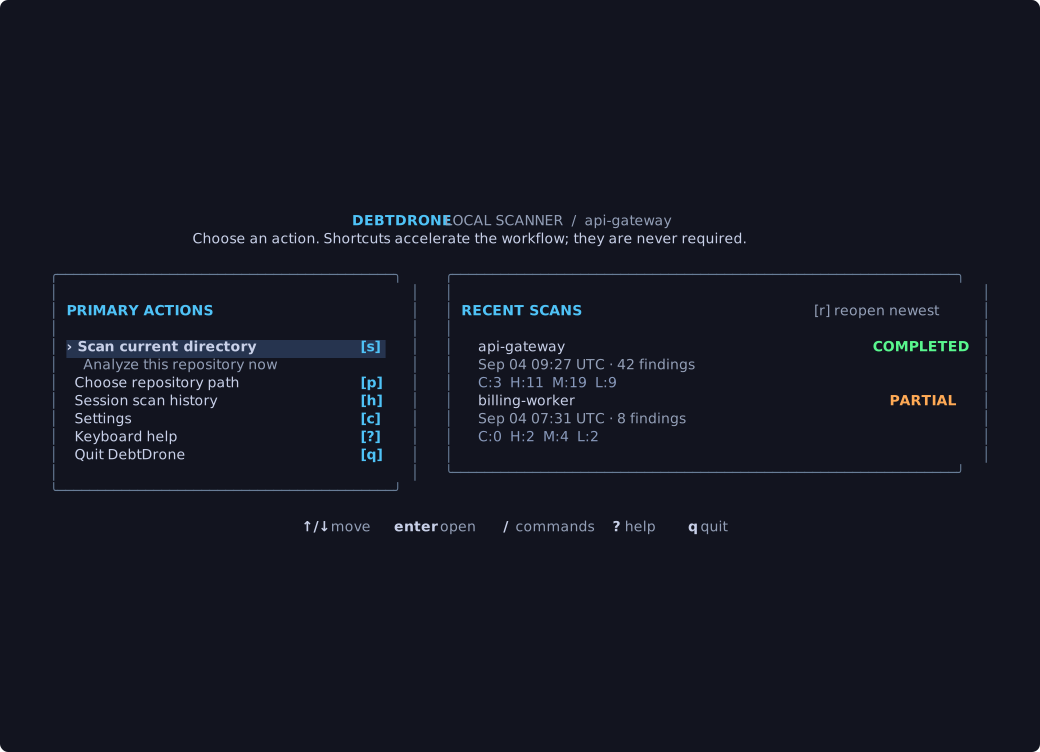 The dashboard. Primary actions sit beside the newest local scan summaries, each row showing its outcome and severity breakdown.
The empty state points first-time users to Scan current directory. If local history cannot be read, the dashboard shows the error while leaving all primary actions available.
The Command Palette
Section titled “The Command Palette”Press / from the dashboard to open the command palette. It offers
tab-completion and shows a description of each command as you navigate. Press
Esc to return to the dashboard.
Available commands:
| Command | Description |
|---|---|
/scan [path] |
Analyze the supplied directory, or the current directory when omitted |
/history |
Browse scans completed in the current TUI session |
/config |
Open the interactive settings editor |
/update |
Check for a new DebtDrone release |
/help |
Show the full keybindings reference |
/quit |
Exit the application |
/scan — Analyzing Your Codebase
Section titled “/scan — Analyzing Your Codebase”/scan [path]Omit path to scan the directory from which DebtDrone was launched. After you
type /scan , the command palette suggests matching directories and Tab accepts
a suggestion. Pressing Enter triggers the analysis engine and transitions
the view through two phases:
Phase 1 — Scanning
Section titled “Phase 1 — Scanning”The scan runs outside the interface’s update loop, so the panel keeps redrawing and stays responsive for the whole run.
A focused progress panel appears at the center of the screen showing the stage (the analyzer currently running), the path being processed, and the elapsed time. Once the scanner reports how many analyzers the run contains, a bar tracks how many have finished — it counts completed analyzers rather than estimating a percentage, so it never claims progress the scan has not made. Before that total is known, the panel shows the stage and elapsed time alone.
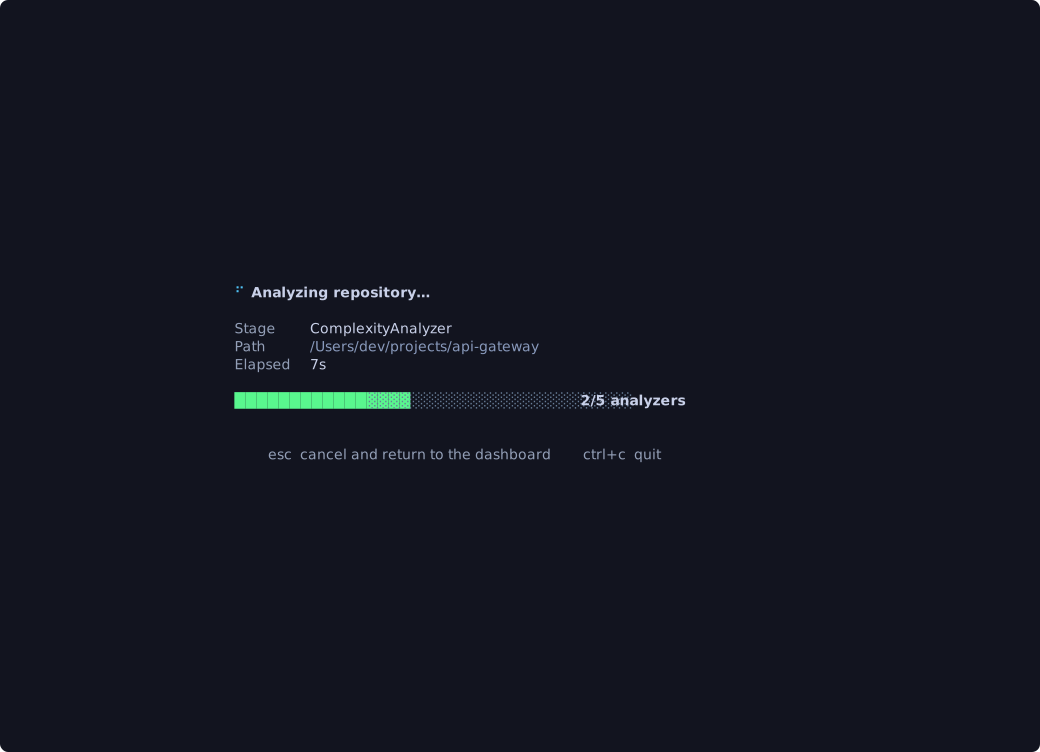 The scan progress panel mid-run. The stage, elapsed time, and completed-analyzer count update as the scan advances.
| Key | Action |
|---|---|
Esc / q |
Cancel the scan and return to the dashboard |
Ctrl+C |
Cancel the scan and exit DebtDrone |
Cancelling stops the scanner itself rather than only hiding its output, and a cancelled scan can never deliver results afterwards. Starting another scan while one is running cancels the first — the newer scan owns the view, and the superseded run cannot overwrite it.
Phase 2 — Results workspace
Section titled “Phase 2 — Results workspace”Once scanning completes, the view expands into a results workspace.
- Summary band: Total findings, the files they touch, estimated debt hours,
and the critical/high/medium/low breakdown for the complete scan, even when
ui.max_resultslimits the rows rendered below it. It is always on screen, so the headline numbers never require navigation. - Findings table (Master): A scrollable list colour-coded by severity
(
criticalin red,highin orange,mediumin yellow,lowin blue), initially ordered most severe first. A category column appears on wider terminals. - Detail pane: The selected finding’s path and location, severity, category, type, analyzer, confidence, debt hours, and message. Additional details, evidence, and surrounding context appear when the analyzer provides them. Long paths and messages wrap here rather than being cut, so anything the table had to shorten can be read in full.
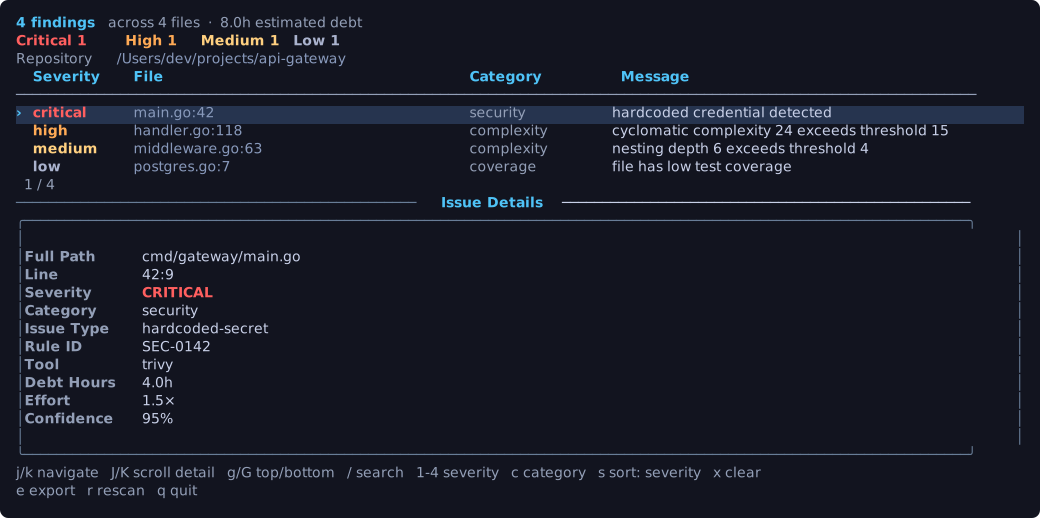 The results view. The summary band reports the whole scan, the table lists findings by severity, and the detail pane shows the analyzer metadata for the selected finding.
Filtering, searching, and sorting
Section titled “Filtering, searching, and sorting”Search, severity, and category filters combine — each one narrows what the others left. The status line names every active filter and how many findings survive them.
| Key | Action |
|---|---|
/ |
Search findings; results narrow as you type. Enter keeps the query, Esc restores the previous one |
1 2 3 4 |
Toggle the critical, high, medium, and low severities. Turning the last one off shows every severity again |
c |
Cycle the category filter through each category present, then back to all |
s |
Cycle the sort order: severity, file, debt hours, category |
x |
Clear search, severity, and category filters. The sort order is a display preference and is kept |
e |
Export the findings currently in view to a private, uniquely named JSON file in the working directory |
r |
Scan the same repository again using the current configuration |
j / k |
Move through findings |
J / K |
Scroll the detail pane |
g / G |
Jump to the first or last finding |
pgup / pgdn |
Page through the table |
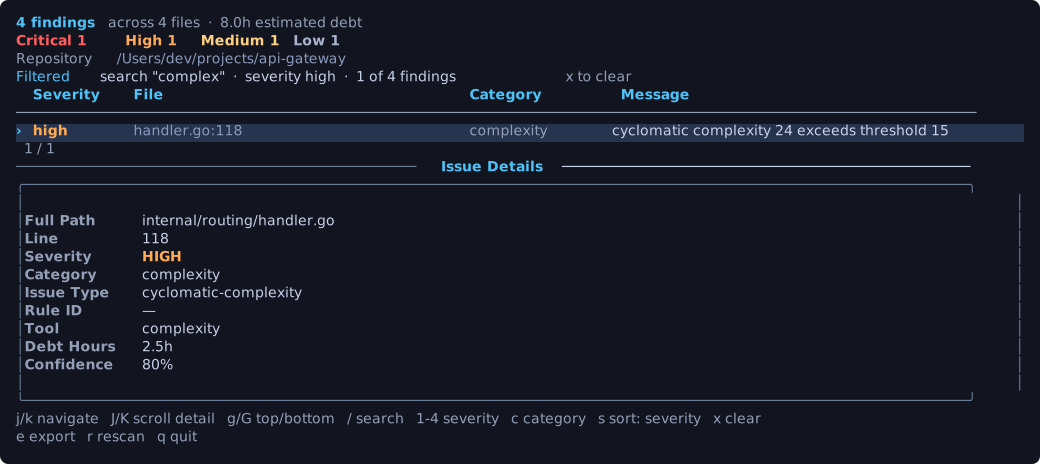 Filtered results. The status line names every active filter and how many findings survive them.
The selected sort mode is the primary order; severity, file, and line provide stable tie-breaking. Switch back to severity sort to restore the critical-to-low order. When a filter change keeps the selected finding, the cursor follows it to its new row; when a filter excludes it, the cursor holds its position rather than jumping back to the top.
If filters exclude everything, the workspace says which filters are active and how to clear them instead of showing an empty table. A scan that finds nothing reports a clean result along with the repository it covered.
When a scan fails
Section titled “When a scan fails”A scan that cannot complete reports the repository it targeted, how long it ran
before failing, and the scanner’s own error text, so the failure can be acted on
without rerunning it blind. Press r to retry the same repository with your
current configuration, or Esc to return to the dashboard.
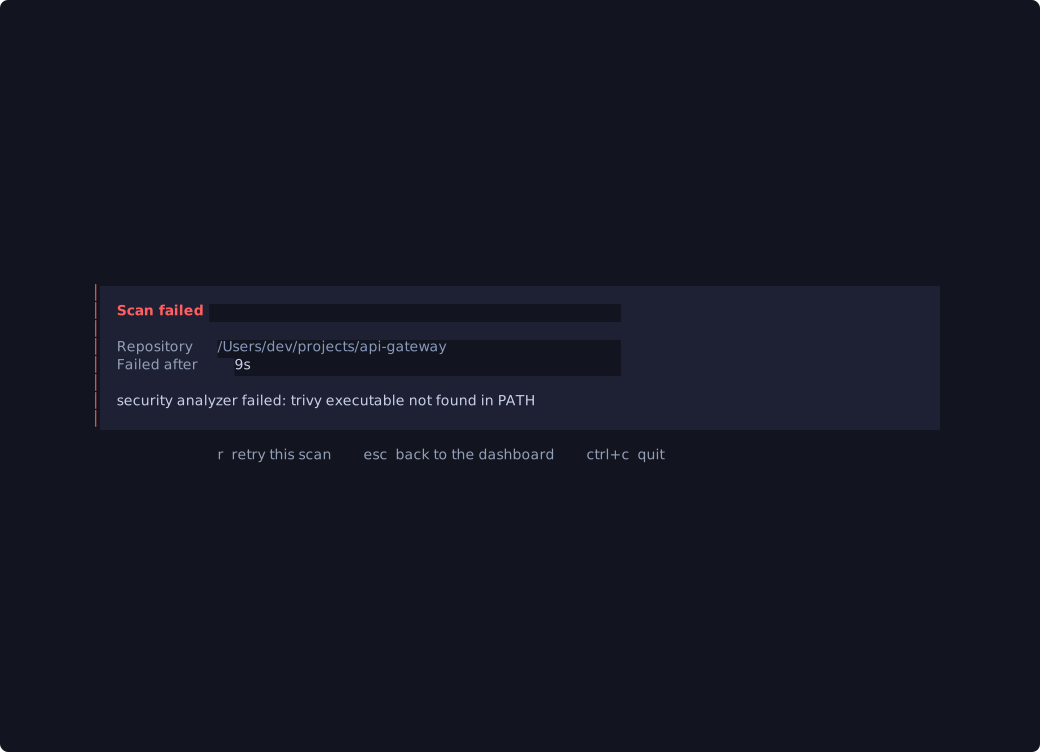 A failed scan. The repository, the time it ran, and the scanner’s own error are all preserved for the retry.
A scan that partially succeeds still shows its findings, with a Partial scan banner naming the analyzers that failed above the results.
Press Esc to return to the dashboard. Completed results are added to the
current TUI session’s history. A privacy-conscious summary is also written to
the bounded local store, but full finding details are discarded when DebtDrone
exits.
/history — Browsing Past Scans
Section titled “/history — Browsing Past Scans”/historyThe history view lists scans completed during the current TUI session, newest
first. The header bar shows each entry’s timestamp, scanned path, total issue
count, and a severity breakdown (C / H / M / L). Selecting an entry
opens a Past Scan Summary panel before you drill further.
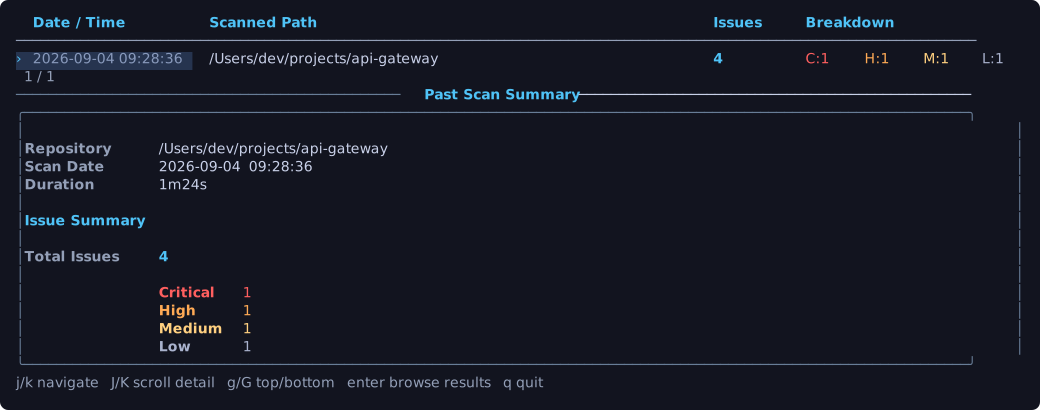 The history browser. The selected entry shows its totals and severity breakdown. Press
 Enter to open the full results view for that run.
Select any entry with Enter to open it in the same master-detail layout used
by the live scan view.
/config — Interactive Settings Editor
Section titled “/config — Interactive Settings Editor”/configThe config view presents resolved settings as a navigable form, organised into General, Quality Gate, Display, and Privacy sections. Values begin with the same file and environment precedence used by headless and MCP scans. Edits become session overrides for scans started in the current TUI.
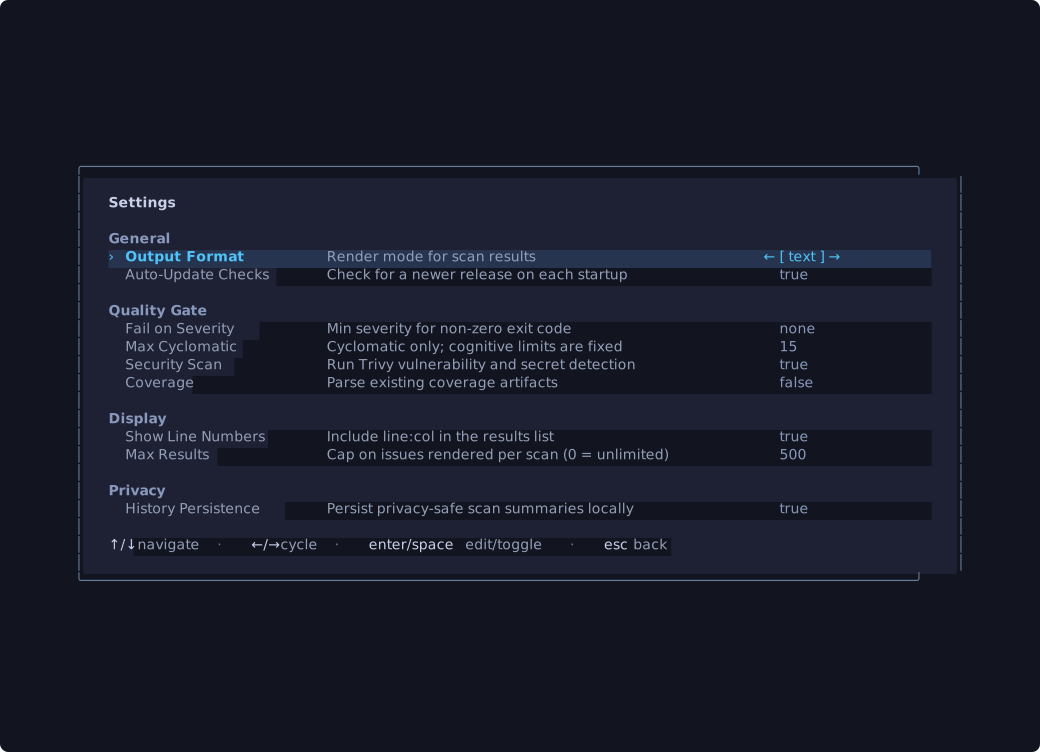 The Settings editor. Navigate with
 j/k, cycle enum values with ←/→, and toggle booleans with Enter or Space.
| Section | Setting | Description |
|---|---|---|
| General | Output Format | text or json for TUI result presentation |
| General | Auto-Update Checks | The resolved launch value controls the automatic startup check; changing it after launch does not rerun the check |
| Quality Gate | Fail on Severity | Shared value for headless quality gates; TUI scans do not return process-level quality-gate failures |
| Quality Gate | Max Cyclomatic | High cyclomatic complexity threshold per function; critical starts above twice the value (default: 15). Cognitive complexity and nesting limits are fixed and can still report a function below this value |
| Quality Gate | Security Scan | Run Trivy vulnerability and secret detection |
| Quality Gate | Coverage | Parse existing coverage artifacts without running repository tests |
| Display | Show Line Numbers | Include or hide line and column information in rendered results |
| Display | Max Results | Cap findings rendered in the TUI; 0 is unlimited |
| Privacy | History Persistence | Write or skip new privacy-safe local scan summaries |
Editing a Value
Section titled “Editing a Value”- Navigate to the setting with
j/k. - Press
Enterto enter edit mode. - For boolean settings,
EnterorSpacetoggles the value directly. - For enum settings (like Output Format), use
←/→to cycle through valid values andEnterto confirm. - For integer settings, type the new value and press
Enter. - Press
Escto cancel an edit without saving.
Changes remain in memory for the current TUI process. They are not written to
the user config file or .debtdrone.yaml and are discarded when DebtDrone
exits. Use debtdrone config set <key> <value> to persist a setting.
/update — Self-Updater
Section titled “/update — Self-Updater”/updateThe update view connects to the GitHub Releases API, compares the current binary version against the latest published release, and presents the result.
- If you are up to date, a confirmation message is shown.
- If a new version is available, the release notes and changelog are displayed inline. Press
Enterto download and apply the update in-place. The binary replaces itself and the new version is active on the next launch.